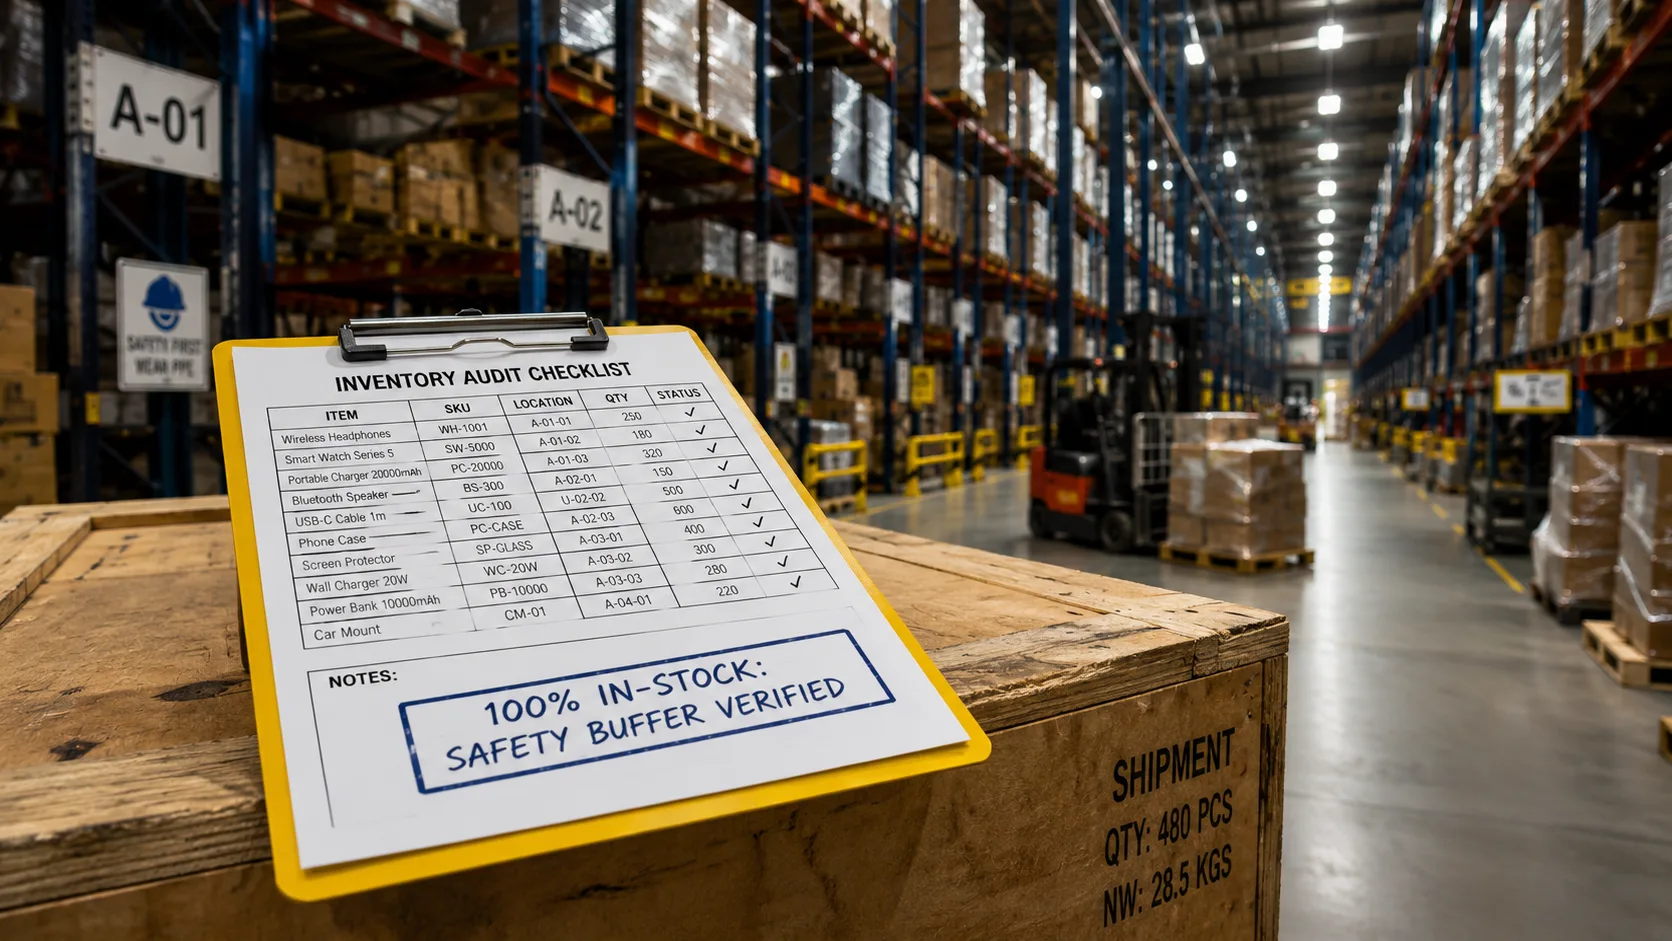
For high-growth e-commerce brands, inventory management is where balance sheets are either won or destroyed. Running out of stock on your hero product halts organic ranking momentum on Amazon and resets machine-learning attribution on Meta Ads. Conversely, over-ordering ties up precious working capital and triggers punitive warehouse storage surcharges.
Most mid-market operators forecast inventory using intuition or basic 30-day sales averages. This fails to account for supplier manufacturing variance, port congestion delays, and sales velocity spikes caused by ad scaling.
This operational framework delivers the standard mathematical forecasting models used by eight-figure D2C brands to maintain a 98%+ in-stock rate without over-committing capital.
🧮 The Universal Reorder Point (ROP) Formula
Lead Time Demand = Average Daily Sales (Units) × Supplier Lead Time (Days)
Safety Stock = (Max Daily Sales × Max Lead Time) - (Avg Daily Sales × Avg Lead Time)
1. Inventory Carrying Cost vs. Stockout Bleed Matrix
Evaluate the hidden operational losses of being understocked versus overstocked across a 60-day window:
| Operational Variable | Stockout Penalty (Understock) | Holding Penalty (Overstock) |
|---|---|---|
| Revenue & Margin Impact | 100% lost contribution margin on unserved orders. | Capital locked up at 18-24% annual cost of debt. |
| Paid Ad Machine Learning | Pauses campaigns, resets Meta ASC attribution models. | No negative impact on paid campaign continuity. |
| Organic Marketplace Rank | Amazon algorithm drops Best Seller Rank (BSR) to competitors. | Preserves keyword authority and review velocity. |
| Warehouse Surcharges | Zero additional pallet storage costs. | Aged inventory fees and 3PL pallet retention penalties. |
📊 Calculate Exact Inventory Profit Margins
Model your supplier landed unit costs and warehouse fulfillment deducts using our live Amazon FBA Fee & Profit Calculator.
2. Real-World Worked Scenario: Calculating Exact PO Triggers
Let us model a scaling D2C brand selling an average of 40 units per day with historical holiday spikes up to 75 units per day:
- • Baseline Variables: Average Daily Sales = 40 units | Max Daily Sales = 75 units | Average Lead Time = 30 days | Max Port Delay Lead Time = 45 days.
- • Step 1 (Lead Time Demand): 40 units/day × 30 days = 1,200 units.
- • Step 2 (Safety Stock Calculation): (75 max units × 45 max days) - (40 avg units × 30 avg days) = 3,375 - 1,200 = 2,175 units (peak buffer) or ~600 units under standard deviations.
- • Step 3 (Trigger Point): Lead Time Demand (1,200) + Safety Stock (600) = 1,800 units.
Action Rule: The instant warehouse inventory drops to 1,800 units, the ERP must automatically issue a Purchase Order (PO) to the factory to prevent a stockout.
🤖 Automated Vendor Communication Prompts
Need standardized supplier contract templates, freight RFQs, and purchase order confirmation letters? Access our Operations & Supplier Prompts inside the AI Vault.
3. The 4-Phase Purchase Order (PO) Execution SOP
Follow this standardized 4-phase protocol to eliminate manufacturing bottlenecks:
- Phase 1: 30% Deposit & Raw Material Lock: Issue supplier deposit 60 days before targeted dispatch date to secure raw material pricing against commodity fluctuations.
- Phase 2: Mid-Production Quality Audit (DPI): Schedule a third-party During-Production Inspection at 50% completion to identify defect clusters before packaging sealing.
- Phase 3: Pre-Shipment Inspection (PSI) & Final Payment: Release remaining 70% balance only after an AQL 2.5 passed inspection report is verified.
- Phase 4: Split-Shipment Freight Routing: If stock is critically low, air-freight 15% of units to bridge inventory while shipping the remaining 85% via ocean freight to protect shipping margin.
Summary: Capital Discipline Through Mathematical Inventory
Inventory management is the backbone of sustainable e-commerce unit economics. By deploying mathematical reorder points, maintaining dynamic safety buffers, and enforcing disciplined supplier quality gates, you protect your cash flow and scale order volume without fear of stockouts.
🚀 Streamline Your Operations
Access our full suite of direct-response copy tools, calculators, and operating playbooks inside the Shopify & D2C Brands Hub.