
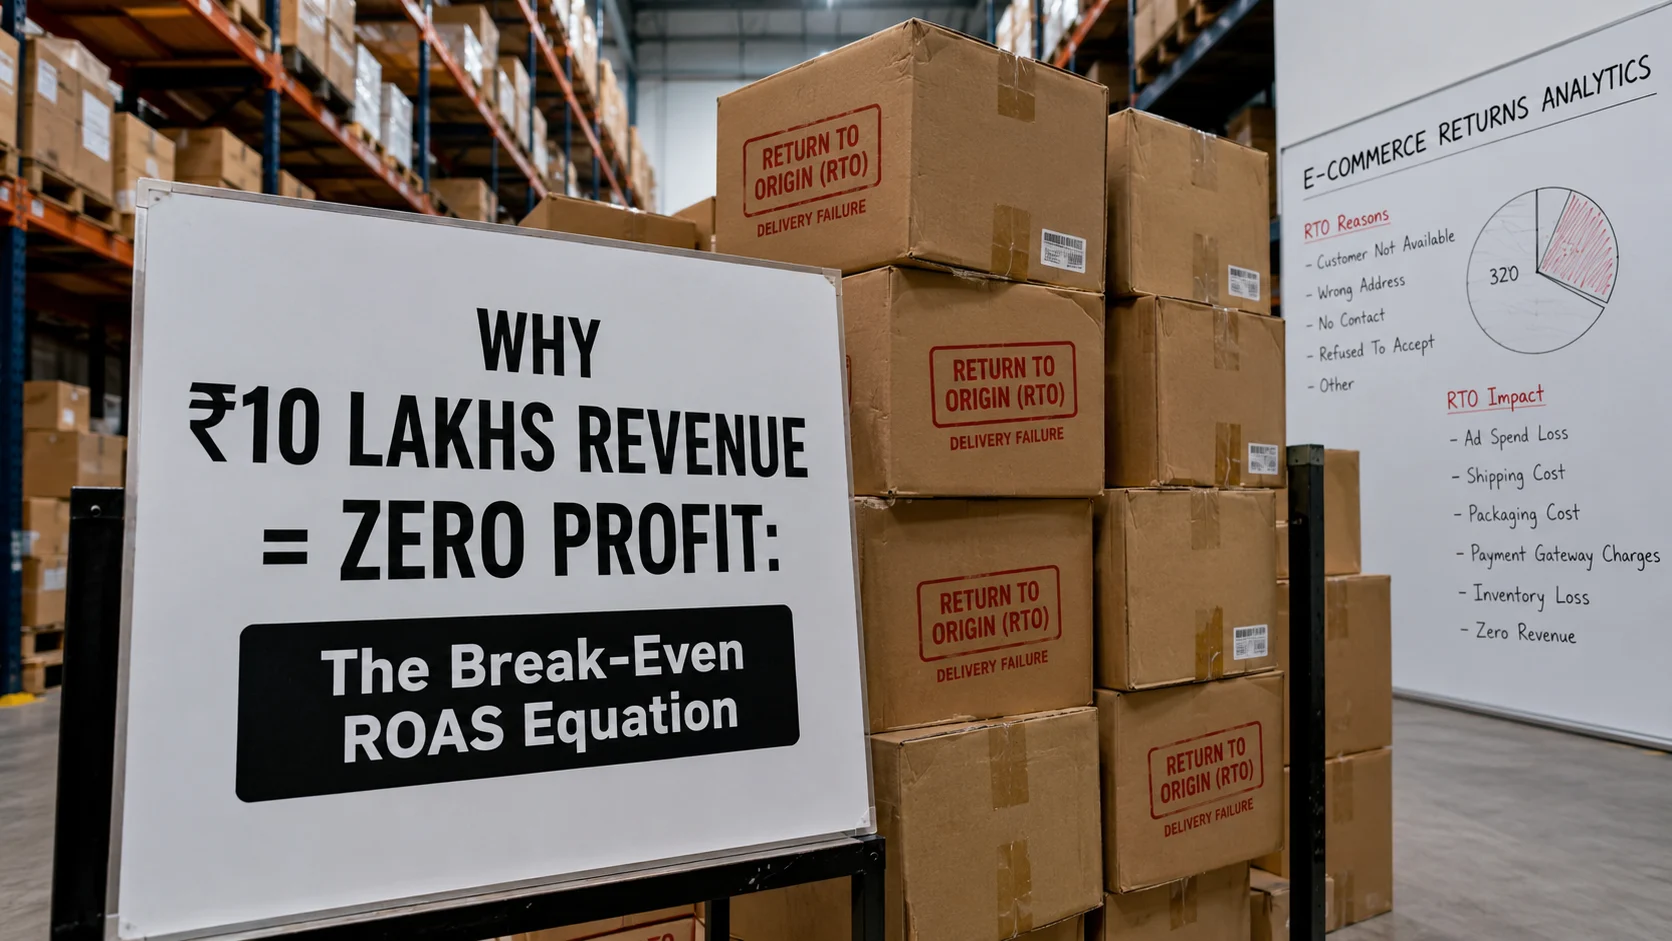
Here is an uncomfortable truth about direct-to-consumer e-commerce: Top-line revenue is vanity, net profit is sanity, but cash flow is reality.
Every single week, store owners scale past ₹10 Lakhs or $50,000 in monthly sales on Meta and Google Ads, celebrating massive revenue screenshots. But when they check their bank account at the end of the month, they are shocked to find zero profit—or worse, a net loss.
How does a business scale revenue rapidly while losing money? The culprit is almost always broken unit economics. If your net contribution margin per delivered order is paper-thin, increasing ad spend does not scale your profit—it only accelerates your path to bankruptcy.
Before spending another rupee on paid customer acquisition, you must master the fundamental mathematical equations that govern e-commerce survival.
📐 The Fundamental Contribution Margin Formula
To calculate real unit profitability, move past basic gross profit and account for every variable expense incurred between checkout and doorstep delivery:
Net Contribution Margin = Selling Price (MSRP) - [ Landed COGS + Packaging + Forward Shipping + Payment Gateway Fee + Ad CPA + Return/RTO Reserve ]
1. Comprehensive Order Unit Economics Breakdown Model
Below is a realistic, itemized financial model for a high-end D2C product retailing at ₹1,500 ($20) in the Indian market:
| Expense Component | Cost Allocation (₹) | % of Retail Price | Operational & Financial Impact Notes |
|---|---|---|---|
| Retail Selling Price (MSRP) | ₹1,500 | 100.0% | Gross revenue collected at customer checkout. |
| Landed Manufacturing COGS | ₹350 | 23.3% | Raw materials, factory labor, PVD gold plating, and inbound freight. |
| Luxury Unboxing & Packaging | ₹50 | 3.3% | Custom magnetic box, velvet jewelry pouch, and printed thank-you card. |
| Forward Freight & Fulfillment | ₹110 | 7.3% | Courier partner charges (Shiprocket/Bluedart) + warehouse pick/pack fee. |
| Payment Gateway Fee (2% Avg) | ₹30 | 2.0% | Payment processor transaction charges (Razorpay / Stripe / PhonePe). |
| RTO / COD Loss Provision | ₹85 | 5.7% | Absorbing double freight charges on rejected Cash-on-Delivery shipments. |
| Gross Contribution Margin | ₹875 | 58.3% | Maximum allowable ceiling budget for Ad CPA + Net Profit. |
📦 Scaling on Amazon FBA or Marketplace Channels?
If you sell on Amazon alongside Shopify, FBA referral fees and storage costs alter your margins completely. Open our Amazon & Marketplace Seller Suite or grab our Amazon SEO & Unit Margin Prompts inside the AI Vault to calculate Amazon net profitability in seconds!
2. The Exact Formula for Break-Even ROAS
Your Break-Even ROAS (Return On Ad Spend) is the single most critical threshold for media buyers. It tells you the exact efficiency your paid ad campaigns must achieve just to cover expenses without taking a loss.
$$\text{Break-Even ROAS} = \frac{\text{Selling Price (MSRP)}}{\text{Gross Contribution Margin}}$$
Plugging in the numbers from our ₹1,500 jewelry model above:
Break-Even ROAS = ₹1,500 ÷ ₹875 = 1.71x ROAS
How to interpret this number: If your Meta Ads Manager or Google PPC campaign achieves an average blended ROAS above 1.71x, your store is net profitable on every new order. If your campaign ROAS drops to 1.50x, every sale actually drains cash from your bank account.
⚠️ The COD RTO Reality Check: How Ignored Non-Deliveries Kill Profit
In Cash-on-Delivery (COD) heavy markets like India, door rejection rates typically run between 15% and 25%. When a customer orders via COD and refuses delivery at the doorstep (Return to Origin or RTO):
- You lose forward freight charges (~₹100).
- You pay reverse freight charges (~₹80).
- You lose the ad spend spent acquiring that non-converting customer (~₹350).
- Outer magnetic packaging often gets damaged during double transit.
The Takeaway: Never calculate Break-Even ROAS assuming a 100% delivery rate. Always factor in a 18-20% RTO buffer into your baseline contribution calculations.
3. Target ROAS vs. Break-Even ROAS (Setting Profit Goals)
Break-even ROAS keeps the lights on, but it does not grow your cash reserves. To achieve a healthy 15% Net Profit Margin after accounting for software subscriptions (Shopify apps, Klaviyo, SMS), team salaries, and office overhead, use this Target ROAS calculation:
| Goal Level | Max Allowable CPA | Required Ad ROAS | Business Outcome |
|---|---|---|---|
| Break-Even Level | ₹875 ($11.60) | 1.71x ROAS | Zero net profit, covers operational COGS. |
| 10% Net Profit Level | ₹725 ($9.60) | 2.06x ROAS | Moderate profitability, steady reinvestment. |
| 20% Net Profit Level (Optimal) | ₹575 ($7.60) | 2.60x ROAS | High-growth profitability & strong cash reserves. |
📋 The Monthly 15-Minute Unit Economic Audit Checklist
Before increasing your daily ad budget on Meta or Google, run through this 5-step financial health check:
- Recalculate landed COGS based on your latest factory bulk invoice.
- Audit shipping invoices for hidden courier weight-discrepancy penalties.
- Calculate your exact 30-day RTO percentage:
(RTO Orders ÷ Total Orders) × 100. - Re-evaluate payment gateway processing charges across prepaid vs. COD orders.
- Set your hard CPA ceiling in Meta Ads Manager based on your Target ROAS threshold.
Actionable Summary for Store Founders
E-commerce profitability isn't luck; it's pure engineering. By mapping out every variable cost down to the exact rupee or cent, you remove emotional guesswork from scaling paid ads.
Know your landed COGS, protect your contribution margins against RTO losses, and never launch a scaling campaign without knowing your exact Break-Even ROAS.
🚀 Access Amazon & E-Com Operation Prompts
Want to automate your marketplace listing optimization, supplier briefs, or financial modeling? Check out our full collection of Amazon SEO Prompts inside the AI Vault today!